07 Oct 2026
12 October, 2026
Monday
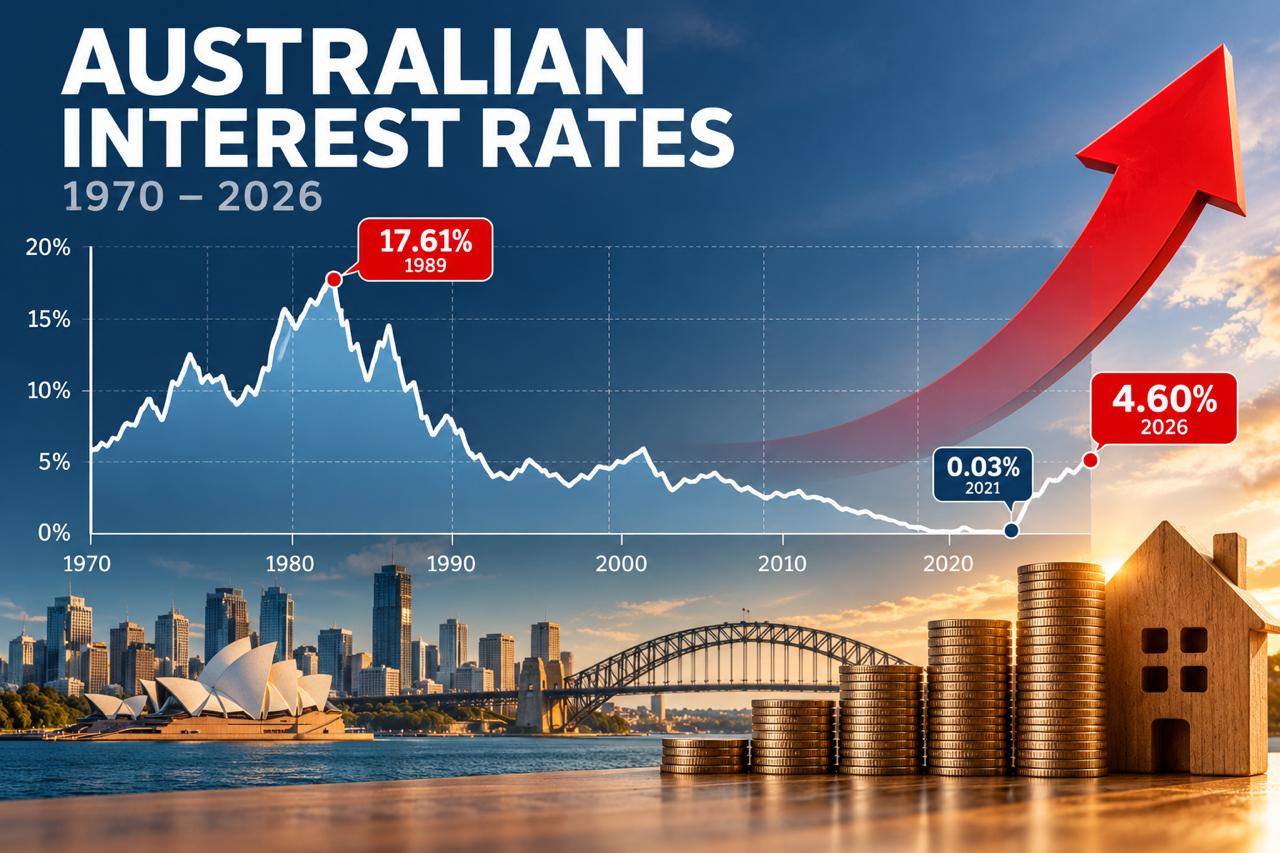
I was sitting at a local cafe with a friend today, talking about the news of the day, when the conversation turned to interest rates.
It was hardly surprising. The Reserve Bank of Australia had just announced another increase in the official cash rate, so interest rates were once again making headlines.
The RBA increased the cash rate by 0.25 percentage points to 4.60 per cent.
In announcing the decision on 29 September 2026, the RBA said inflation remained elevated and that some of the upside risks it had previously identified were materialising. The Board said recent Australian inflation and growth had been stronger than expected, while higher global energy prices were adding further inflationary pressure. The decision was unanimous.
My friend moved to Australia in the early 2000s, so much of her experience of Australian interest rates has been during a very different period from the one I remember growing up with.
As we talked about the latest increase and what it might mean, she asked me a very simple question.
“Can they go much higher? What’s the highest they’ve ever been?”
I knew Australian interest rates had been considerably higher in the past, particularly during the 1980s, but I couldn't immediately tell her exactly how high or when.
So I decided to go back through the numbers.
What I found was a fascinating reminder of just how dramatically Australia's interest-rate environment has changed over the past half-century.
Comparing interest rates over more than 50 years isn't quite as simple as looking up the Reserve Bank cash rate.
The modern RBA cash-rate target doesn't provide a directly comparable measure all the way back to 1970 because Australia's monetary system, and the way interest rates were set and communicated, changed over that period.
For a longer historical comparison, one useful measure is Australia's three-month or 90-day short-term interest rate. It gives us a reasonably consistent way of looking at the broad direction of Australian interest rates over several decades, although it shouldn't be confused with today's official RBA cash-rate target.
And when you put those historical numbers on a graph, the result is quite extraordinary.
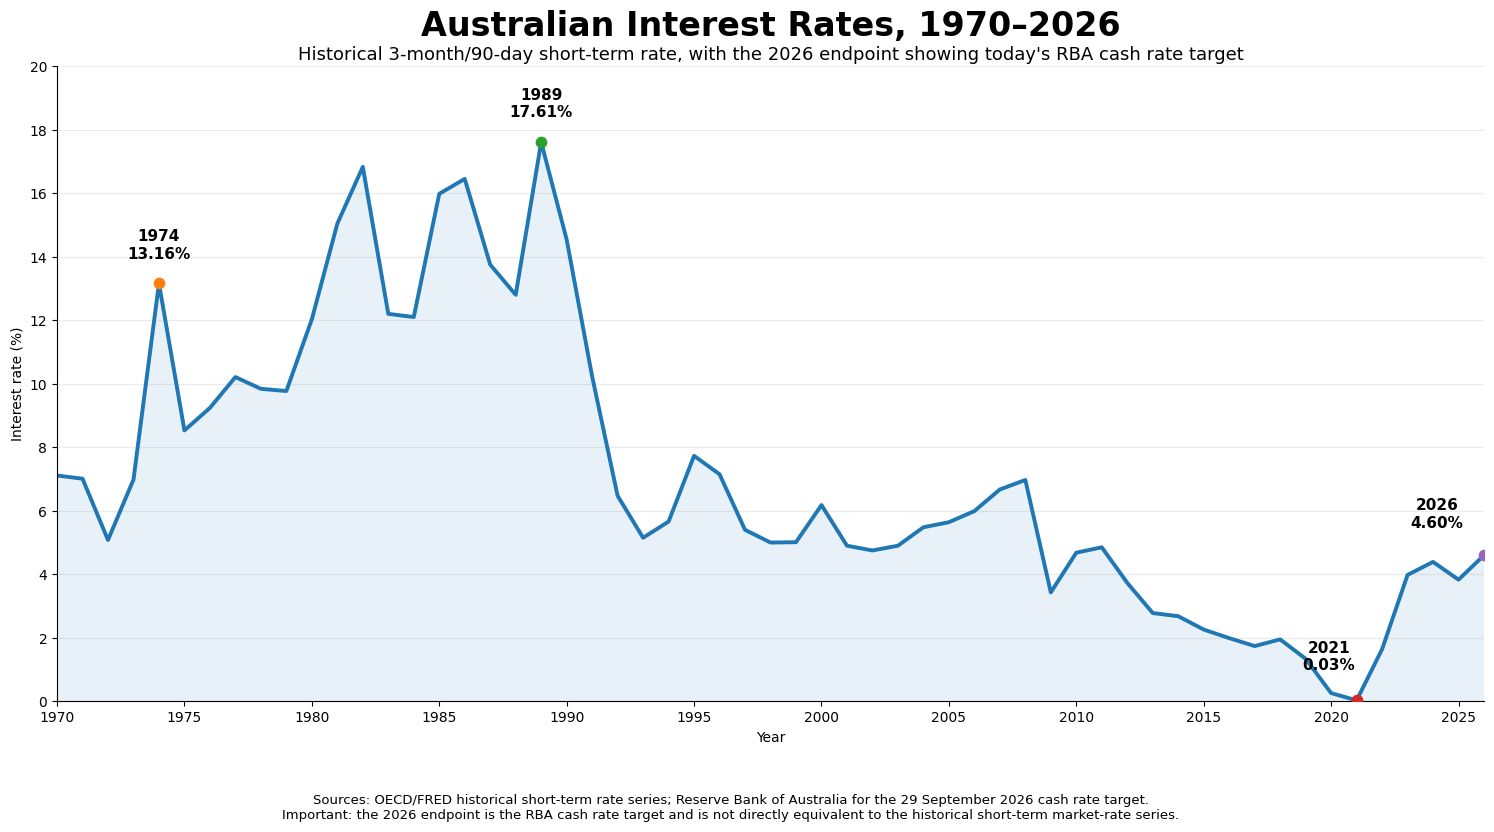
Australian interest rates, 1970–2026. Historical figures use the annual average 3-month/90-day Australian short-term interest rate. The final 2026 point shows the RBA cash-rate target of 4.60 per cent announced on 29 September 2026 and is therefore not directly equivalent to the historical short-term market-rate series.
During the 1970s, short-term interest rates were already considerably higher than the levels Australians have become accustomed to more recently. The annual rate exceeded 13 per cent in 1974 and remained around 8 to 10 per cent for much of the remainder of that decade.
Then came the 1980s.
The numbers from the 1980s almost look shocking through modern eyes.
The annual average short-term rate was about 12 per cent in 1980. It rose to just over 15 per cent in 1981 and almost 16.8 per cent in 1982.
After falling for a period, rates climbed again. The annual average was almost 16 per cent in 1985 and about 16.45 per cent in 1986.
Then, in 1989, the annual average reached approximately 17.61 per cent.
That is an extraordinary number when viewed from today.
It is also worth remembering that these figures are short-term market rates, not the standard variable mortgage rate someone would have seen advertised by their bank. The point isn't to suggest that these historical figures are directly interchangeable with today's RBA cash rate or a modern home loan.
What they do show very clearly is the interest-rate environment Australians were living through.
Double-digit interest rates were not some theoretical possibility.
They happened.
The really interesting part of the history isn't simply how high rates once went. It's what happened afterwards.
By the early 1990s, rates were falling rapidly. The annual short-term rate dropped from about 14.5 per cent in 1990 to 10.2 per cent in 1991 and 6.5 per cent in 1992.
For much of the following two decades, the figures generally sat in the mid-single digits, although there were obviously movements in both directions along the way.
Then came an interest-rate environment that would once have seemed almost unimaginable.
The annual short-term rate fell below 2 per cent in 2016. By 2019 it was around 1.34 per cent.
In 2020, it averaged about 0.26 per cent.
And in 2021, it averaged just 0.03 per cent.
Think about that for a moment.
In 1989, the annual average was around 17.61 per cent.
In 2021, it was around 0.03 per cent.
Those two figures occurred only 32 years apart.
This is where my conversation at the cafe started to make more sense to me.
My friend arrived in Australia in the early 2000s. Someone whose experience of the Australian economy began around that time simply hasn't lived through the same interest-rate environment as somebody who remembers the 1970s and 1980s.
And someone who entered the property market around 2020 or 2021 has experienced something different again.
Our perception of what constitutes a "high" interest rate is inevitably influenced by what we have experienced before.
If you've spent years seeing interest rates close to zero, today's 4.60 per cent cash rate can look particularly high.
But that doesn't mean the financial impact isn't real.
There is an obvious trap in looking at these historical numbers.
It would be very easy to look at the double-digit rates of the late 1980s and conclude that today's borrowers have little to complain about.
I don't think the comparison is that simple.
Interest rates are only one part of the equation.
House prices have changed enormously. The amount households borrow has changed. Wages have changed. Household debt has changed. The proportion of income required to service a mortgage can be very different.
A much lower interest rate applied to a much larger mortgage can still create enormous pressure on a household budget.
So saying that interest rates were much higher in 1989 doesn't tell us that borrowers had it harder then or have it harder now.
It simply tells us that the percentage itself doesn't tell the whole story.
This brings me back to the question my friend actually asked.
Could Australian interest rates go higher than today's 4.60 per cent?
History gives us a fairly straightforward answer to one part of that question.
They can.
Australia has experienced interest rates considerably higher than the levels we have become accustomed to in recent decades.
But there is a very important distinction between saying rates can go higher and predicting that they will.
A historical graph can't tell us what the Reserve Bank will do next.
The RBA itself made that distinction important in today's announcement. The Board said it would continue doing what it considered necessary to return inflation sustainably to target, including increasing the cash-rate target further if needed. It also said future decisions would be guided by incoming data and its assessment of the economic outlook and risks.
That doesn't tell us what the next interest-rate decision will be.
Neither does history.
The economic circumstances that produced the interest rates of the 1970s and 1980s were different from those Australia faces today. Inflation, employment, wages, economic growth, government policy, global economic conditions and the structure of household debt all contribute to the environment in which monetary policy operates.
History provides context.
It doesn't provide a forecast.
Looking at the entire period from 1970 to today also made me wonder whether we sometimes frame the question the wrong way.
Instead of asking only why interest rates have become so high, perhaps part of the story is just how extraordinarily low they became.
An annual short-term rate of 0.03 per cent in 2021 wasn't simply low compared with the 1980s. It was an extraordinary point in more than half a century of Australian interest-rate history.
For anyone who borrowed money during that period, however, those extraordinarily low rates were real. They influenced borrowing costs and the repayments people became accustomed to.
When rates subsequently moved higher, the adjustment was very real as well.
And perhaps that's why conversations about interest rates can sometimes become arguments between generations.
Someone remembers paying extraordinarily high rates decades ago and says, “You should have seen what we paid.”
Someone else looks at the size of their mortgage today and says, “You should see what I'm paying.”
Both can be describing genuine financial pressure in completely different economic environments.
When my friend asked me whether interest rates could go much higher, my first instinct was to think back to the rates I remembered from decades ago.
Looking at the numbers confirmed it.
Australian interest rates have been much higher before.
But perhaps the more interesting thing the history shows is just how much our perception of a "normal" interest rate depends on the period we've lived through.
Someone who remembers the 1980s might look at today's rates and see something relatively modest. Someone whose experience of borrowing began around 2020 or 2021 may see exactly the opposite.
Neither perspective changes what a household actually has to find each month to pay its mortgage.
And a chart showing more than 50 years of interest rates shouldn't be used to predict where rates are going next.
It can only remind us of where they have been.
So could interest rates go higher than today's 4.60 per cent? History tells us they can. Whether they will is an entirely different question.
This article is a personal reflection on the history of Australian interest rates and is provided for general information only. It does not provide financial advice or make recommendations about any financial product or financial decision.